The Best And The Worst States For Finding Tech Talent
Solution providers looking to expand geographically will need to hire highly educated and experienced workers to succeed. Here’s where to look for the most talented workers (and where not to).
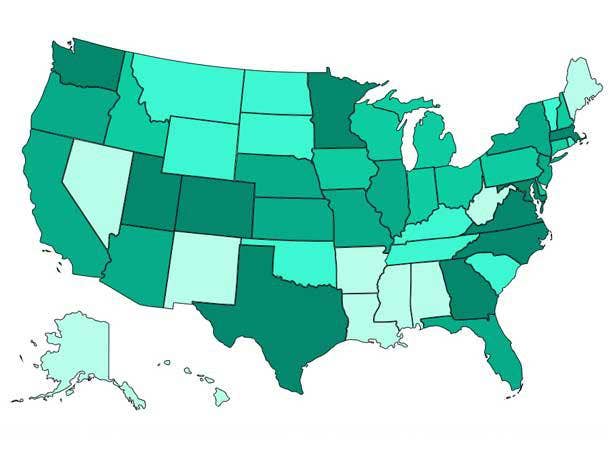
Where The Educated Workers Are
The year started out with national unemployment at historic lows before surging in April as the COVID-19 pandemic and ensuing recession took hold. While the unemployment rate has steadily declined in recent months, it still remained high at 8.4 percent in August.
A number of solution providers have told CRN that with employee cutbacks at large IT vendors and layoffs among IT staffs in non-technology businesses, the pools of experienced engineers, developers, sales representatives and other tech talent has increased somewhat from the start of 2020. But the fact is that finding and hiring well-educated, highly experienced people remains one of the biggest challenges for solution provider owners and executives.
As part of the CRN 2020 Best States for Solution Providers analysis, we’ve ranked the states according to the overall education and experience levels of the pool of available workers. The analysis included what percent of each state’s total workforce is technology jobs and the overall gain or loss in tech employment in each state from 2018 to 2019: Both statistics and accompanying rankings came from the CompTIA 2020 Cyberstates Report.
The analysis also included state rankings from the Bloomberg 2020 U.S. State Innovation Index for available workers with science and engineering bachelor’s degrees and available workers with advanced degrees in STEM (science, technology, engineering and math) subjects. And the analysis incorporated state rankings for workforce education attainment levels from U.S. News Best States and the WalletHub Most Educated States reports.
The following are the 10 states with the highest rankings for educated and experienced workers, listed from No. 10 to No. 1. That is followed by the states with the lowest rankings listed from No. 41 to No. 50. Keep in mind that states with the best talent are often the most expensive states to do business in, have higher taxes, have more solution providers to compete with and other challenging traits.

Best States No. 10: Vermont
Tech Employment Job Gain/Loss 2018 to 2019: -75 (Rank: 47)
Tech Jobs as Percent of Total Workforce: 6.5 Percent (Rank: 29)
Science + Engineering Bachelor’s Degree: (Rank: 9)
STEM Concentration Advanced Degree: (Rank: 30)
Education Attainment Levels (U.S. News): (Rank: 8)
Education Attainment Levels (WalletHub): (Rank: 4)

Best States No. 9: Utah
Tech Employment Job Gain/Loss 2018 to 2019: 5,746 (Rank: 16)
Tech Jobs as Percent of Total Workforce: 9.4 Percent (Rank: 8)
Science + Engineering Bachelor’s Degree: (Rank: 28)
STEM Concentration Advanced Degree: (Rank: 8)
Education Attainment Levels (U.S. News): (Rank: 10)
Education Attainment Levels (WalletHub): (Rank: 11)

Best States No. 8: Connecticut
Tech Employment Job Gain/Loss 2018 to 2019: 1,301 (Rank: 33)
Tech Jobs as Percent of Total Workforce: 7.8 Percent (Rank: 14)
Science + Engineering Bachelor’s Degree: (Rank: 12)
STEM Concentration Advanced Degree: (Rank: 12)
Education Attainment Levels (U.S. News): (Rank: 12)
Education Attainment Levels (WalletHub): (Rank: 5)

Best States No. 7: New Hampshire
Tech Employment Job Gain/Loss 2018 to 2019: 2,512 (Rank: 28)
Tech Jobs as Percent of Total Workforce: 10.1 Percent (Rank: 6)
Science + Engineering Bachelor’s Degree: (Rank: 10)
STEM Concentration Advanced Degree: (Rank: 7)
Education Attainment Levels (U.S. News): (Rank: 5)
Education Attainment Levels (WalletHub): (Rank: 8)

Best States No. 6: New Jersey
Tech Employment Job Gain/Loss 2018 to 2019: 4,383 (Rank: 23)
Tech Jobs as Percent of Total Workforce: 8.0 Percent (Rank: 12)
Science + Engineering Bachelor’s Degree: (Rank: 11)
STEM Concentration Advanced Degree: (Rank: 14)
Education Attainment Levels (U.S. News): (Rank: 2)
Education Attainment Levels (WalletHub): (Rank: 9)

Best States No. 5: Colorado
Tech Employment Job Gain/Loss 2018 to 2019: 10,118 (Rank: 4)
Tech Jobs as Percent of Total Workforce: 10.5 Percent (Rank: 4)
Science + Engineering Bachelor’s Degree: (Rank: 7)
STEM Concentration Advanced Degree: (Rank: 5)
Education Attainment Levels (U.S. News): (Rank: 11)
Education Attainment Levels (WalletHub): (Rank: 3)

Best States No. 4: Virginia
Tech Employment Job Gain/Loss 2018 to 2019: 9,010 (Rank: 12)
Tech Jobs as Percent of Total Workforce: 10.7 Percent (Rank: 2)
Science + Engineering Bachelor’s Degree: (Rank: 4)
STEM Concentration Advanced Degree: (Rank: 4)
Education Attainment Levels (U.S. News): (Rank: 7)
Education Attainment Levels (WalletHub): (Rank: 6)

Best States No. 3: Washington
Tech Employment Job Gain/Loss 2018 to 2019: 14,281 (Rank: 6)
Tech Jobs as Percent of Total Workforce: 10.7 Percent (Rank: 2)
Science + Engineering Bachelor’s Degree: (Rank: 1)
STEM Concentration Advanced Degree: (Rank: 2)
Education Attainment Levels (U.S. News): (Rank: 4)
Education Attainment Levels (WalletHub): (Rank: 7)

Best States No. 2: Maryland
Tech Employment Job Gain/Loss 2018 to 2019: 5,885 (Rank: 15)
Tech Jobs as Percent of Total Workforce: 10.3 Percent (Rank: 5)
Science + Engineering Bachelor’s Degree: (Rank: 2)
STEM Concentration Advanced Degree: (Rank: 1)
Education Attainment Levels (U.S. News): (Rank: 13)
Education Attainment Levels (WalletHub): (Rank: 2)

Best States No. 1: Massachusetts
Tech Employment Job Gain/Loss 2018 to 2019: 11,544 (Rank: 1)
Tech Jobs as Percent of Total Workforce: 11.5 Percent (Rank: 1)
Science + Engineering Bachelor’s Degree: (Rank: 5)
STEM Concentration Advanced Degree: (Rank: 3)
Education Attainment Levels (U.S. News): (Rank: 1)
Education Attainment Levels (WalletHub): (Rank: 1)

Worst States No. 41: New Mexico
Tech Employment Job Gain/Loss 2018 to 2019: 702 (Rank: 37)
Tech Jobs as Percent of Total Workforce: 7.6 Percent (Rank: 16)
Science + Engineering Bachelor’s Degree: (Rank: 13)
STEM Concentration Advanced Degree: (Rank: 21)
Education Attainment Levels (U.S. News): (Rank: 49)
Education Attainment Levels (WalletHub): (Rank: 42)

Worst States No. 42: Oklahoma
Tech Employment Job Gain/Loss 2018 to 2019: 1,436 (Rank: 32)
Tech Jobs as Percent of Total Workforce: 5.2 Percent (Rank: 38)
Science + Engineering Bachelor’s Degree: (Rank: 46)
STEM Concentration Advanced Degree: (Rank: 32)
Education Attainment Levels (U.S. News): (Rank: 39)
Education Attainment Levels (WalletHub): (Rank: 40)

Worst States No. 43: South Carolina
Tech Employment Job Gain/Loss 2018 to 2019: 5,019 (Rank: 20)
Tech Jobs as Percent of Total Workforce: 5.8 Percent (Rank: 33)
Science + Engineering Bachelor’s Degree: (Rank: 34)
STEM Concentration Advanced Degree: (Rank: 37)
Education Attainment Levels (U.S. News): (Rank: 43)
Education Attainment Levels (WalletHub): (Rank: 44)

Worst States No. 44: Nevada
Tech Employment Job Gain/Loss 2018 to 2019: 4,047 (Rank: 24)
Tech Jobs as Percent of Total Workforce: 4.8 Percent (Rank: 41)
Science + Engineering Bachelor’s Degree: (Rank: 31)
STEM Concentration Advanced Degree: (Rank: 49)
Education Attainment Levels (U.S. News): (Rank: 45)
Education Attainment Levels (WalletHub): (Rank: 43)

Worst States No. 45: Kentucky
Tech Employment Job Gain/Loss 2018 to 2019: 527 (Rank: 40)
Tech Jobs as Percent of Total Workforce: 4.8 Percent (Rank: 41)
Science + Engineering Bachelor’s Degree: (Rank: 42)
STEM Concentration Advanced Degree: (Rank: 45)
Education Attainment Levels (U.S. News): (Rank: 38)
Education Attainment Levels (WalletHub): (Rank: 45)

Worst States No. 46: Alabama
Tech Employment Job Gain/Loss 2018 to 2019: 3,197 (Rank: 26)
Tech Jobs as Percent of Total Workforce: 7.1 Percent (Rank: 20)
Science + Engineering Bachelor’s Degree: (Rank: 40)
STEM Concentration Advanced Degree: (Rank: 29)
Education Attainment Levels (U.S. News): (Rank: 50)
Education Attainment Levels (WalletHub): (Rank: 46)

Worst States No. 47: Arkansas
Tech Employment Job Gain/Loss 2018 to 2019: -548 (Rank: 50)
Tech Jobs as Percent of Total Workforce: 4.3 Percent (Rank: 45)
Science + Engineering Bachelor’s Degree: (Rank: 43)
STEM Concentration Advanced Degree: (Rank: 47)
Education Attainment Levels (U.S. News): (Rank: 42)
Education Attainment Levels (WalletHub): (Rank: 47)

Worst States No. 48: West Virginia
Tech Employment Job Gain/Loss 2018 to 2019: 424 (Rank: 41)
Tech Jobs as Percent of Total Workforce: 4.2 Percent (Rank: 47)
Science + Engineering Bachelor’s Degree: (Rank: 45)
STEM Concentration Advanced Degree: (Rank: 46)
Education Attainment Levels (U.S. News): (Rank: 44)
Education Attainment Levels (WalletHub): (Rank: 49)

Worst States No. 49: Louisiana
Tech Employment Job Gain/Loss 2018 to 2019: 1,181 (Rank: 35)
Tech Jobs as Percent of Total Workforce: 4.2 Percent (Rank: 47)
Science + Engineering Bachelor’s Degree: (Rank: 47)
STEM Concentration Advanced Degree: (Rank: 48)
Education Attainment Levels (U.S. News): (Rank: 48)
Education Attainment Levels (WalletHub): (Rank: 48)

Worst States No. 50: Mississippi
Tech Employment Job Gain/Loss 2018 to 2019: -141 (Rank: 48)
Tech Jobs as Percent of Total Workforce: 3.7 Percent (Rank: 49)
Science + Engineering Bachelor’s Degree: (Rank: 50)
STEM Concentration Advanced Degree: (Rank: 50)
Education Attainment Levels (U.S. News): (Rank: 46)
Education Attainment Levels (WalletHub): (Rank: 50)